Imagine you’re scrolling through your social media feed. You pause at a business ad because of its striking logo and catchy tagline. This is branding in action—it’s the impression that stays with you long after you’ve seen the ad.
For small and medium-sized businesses (SMBs), branding isn’t just a luxury; it’s a necessity. Research by Lucidpress reveals that consistent branding across platforms can boost revenue by up to 23%. Yet, many SMBs struggle with creating a cohesive brand identity.
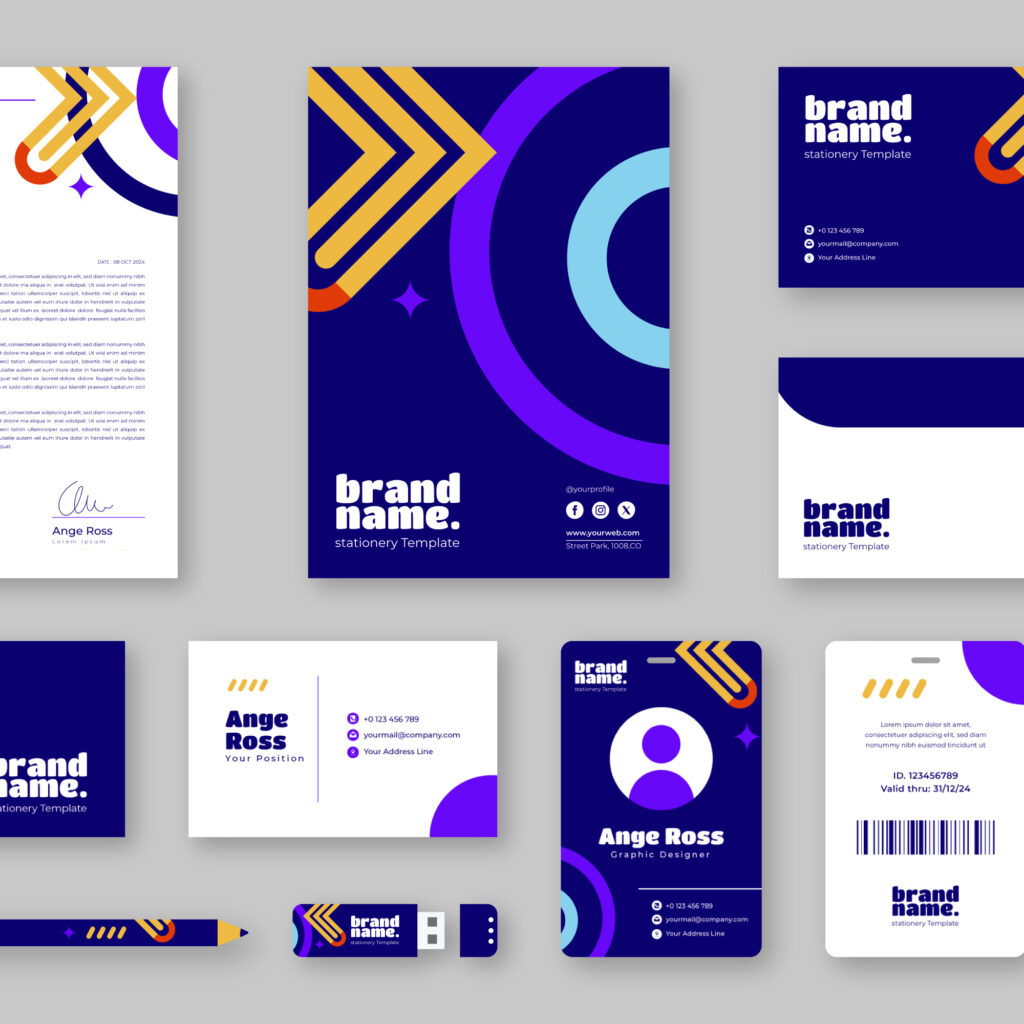
This guide will break down what branding means, why it matters for SMBs, and how you can create a strong brand without breaking the bank.
What is Branding?
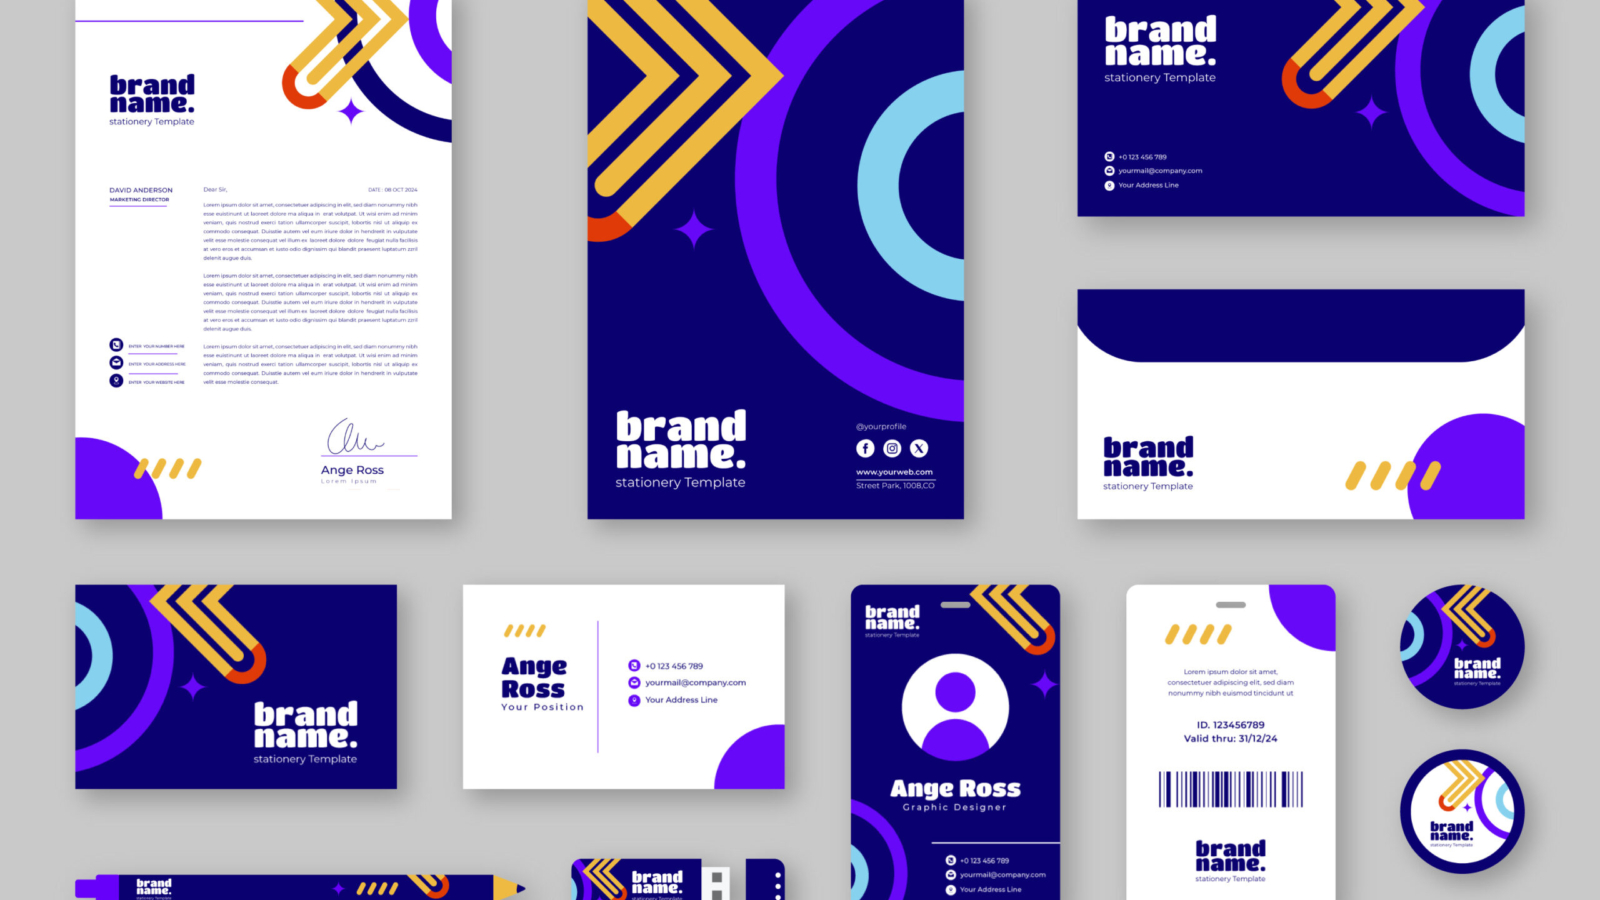
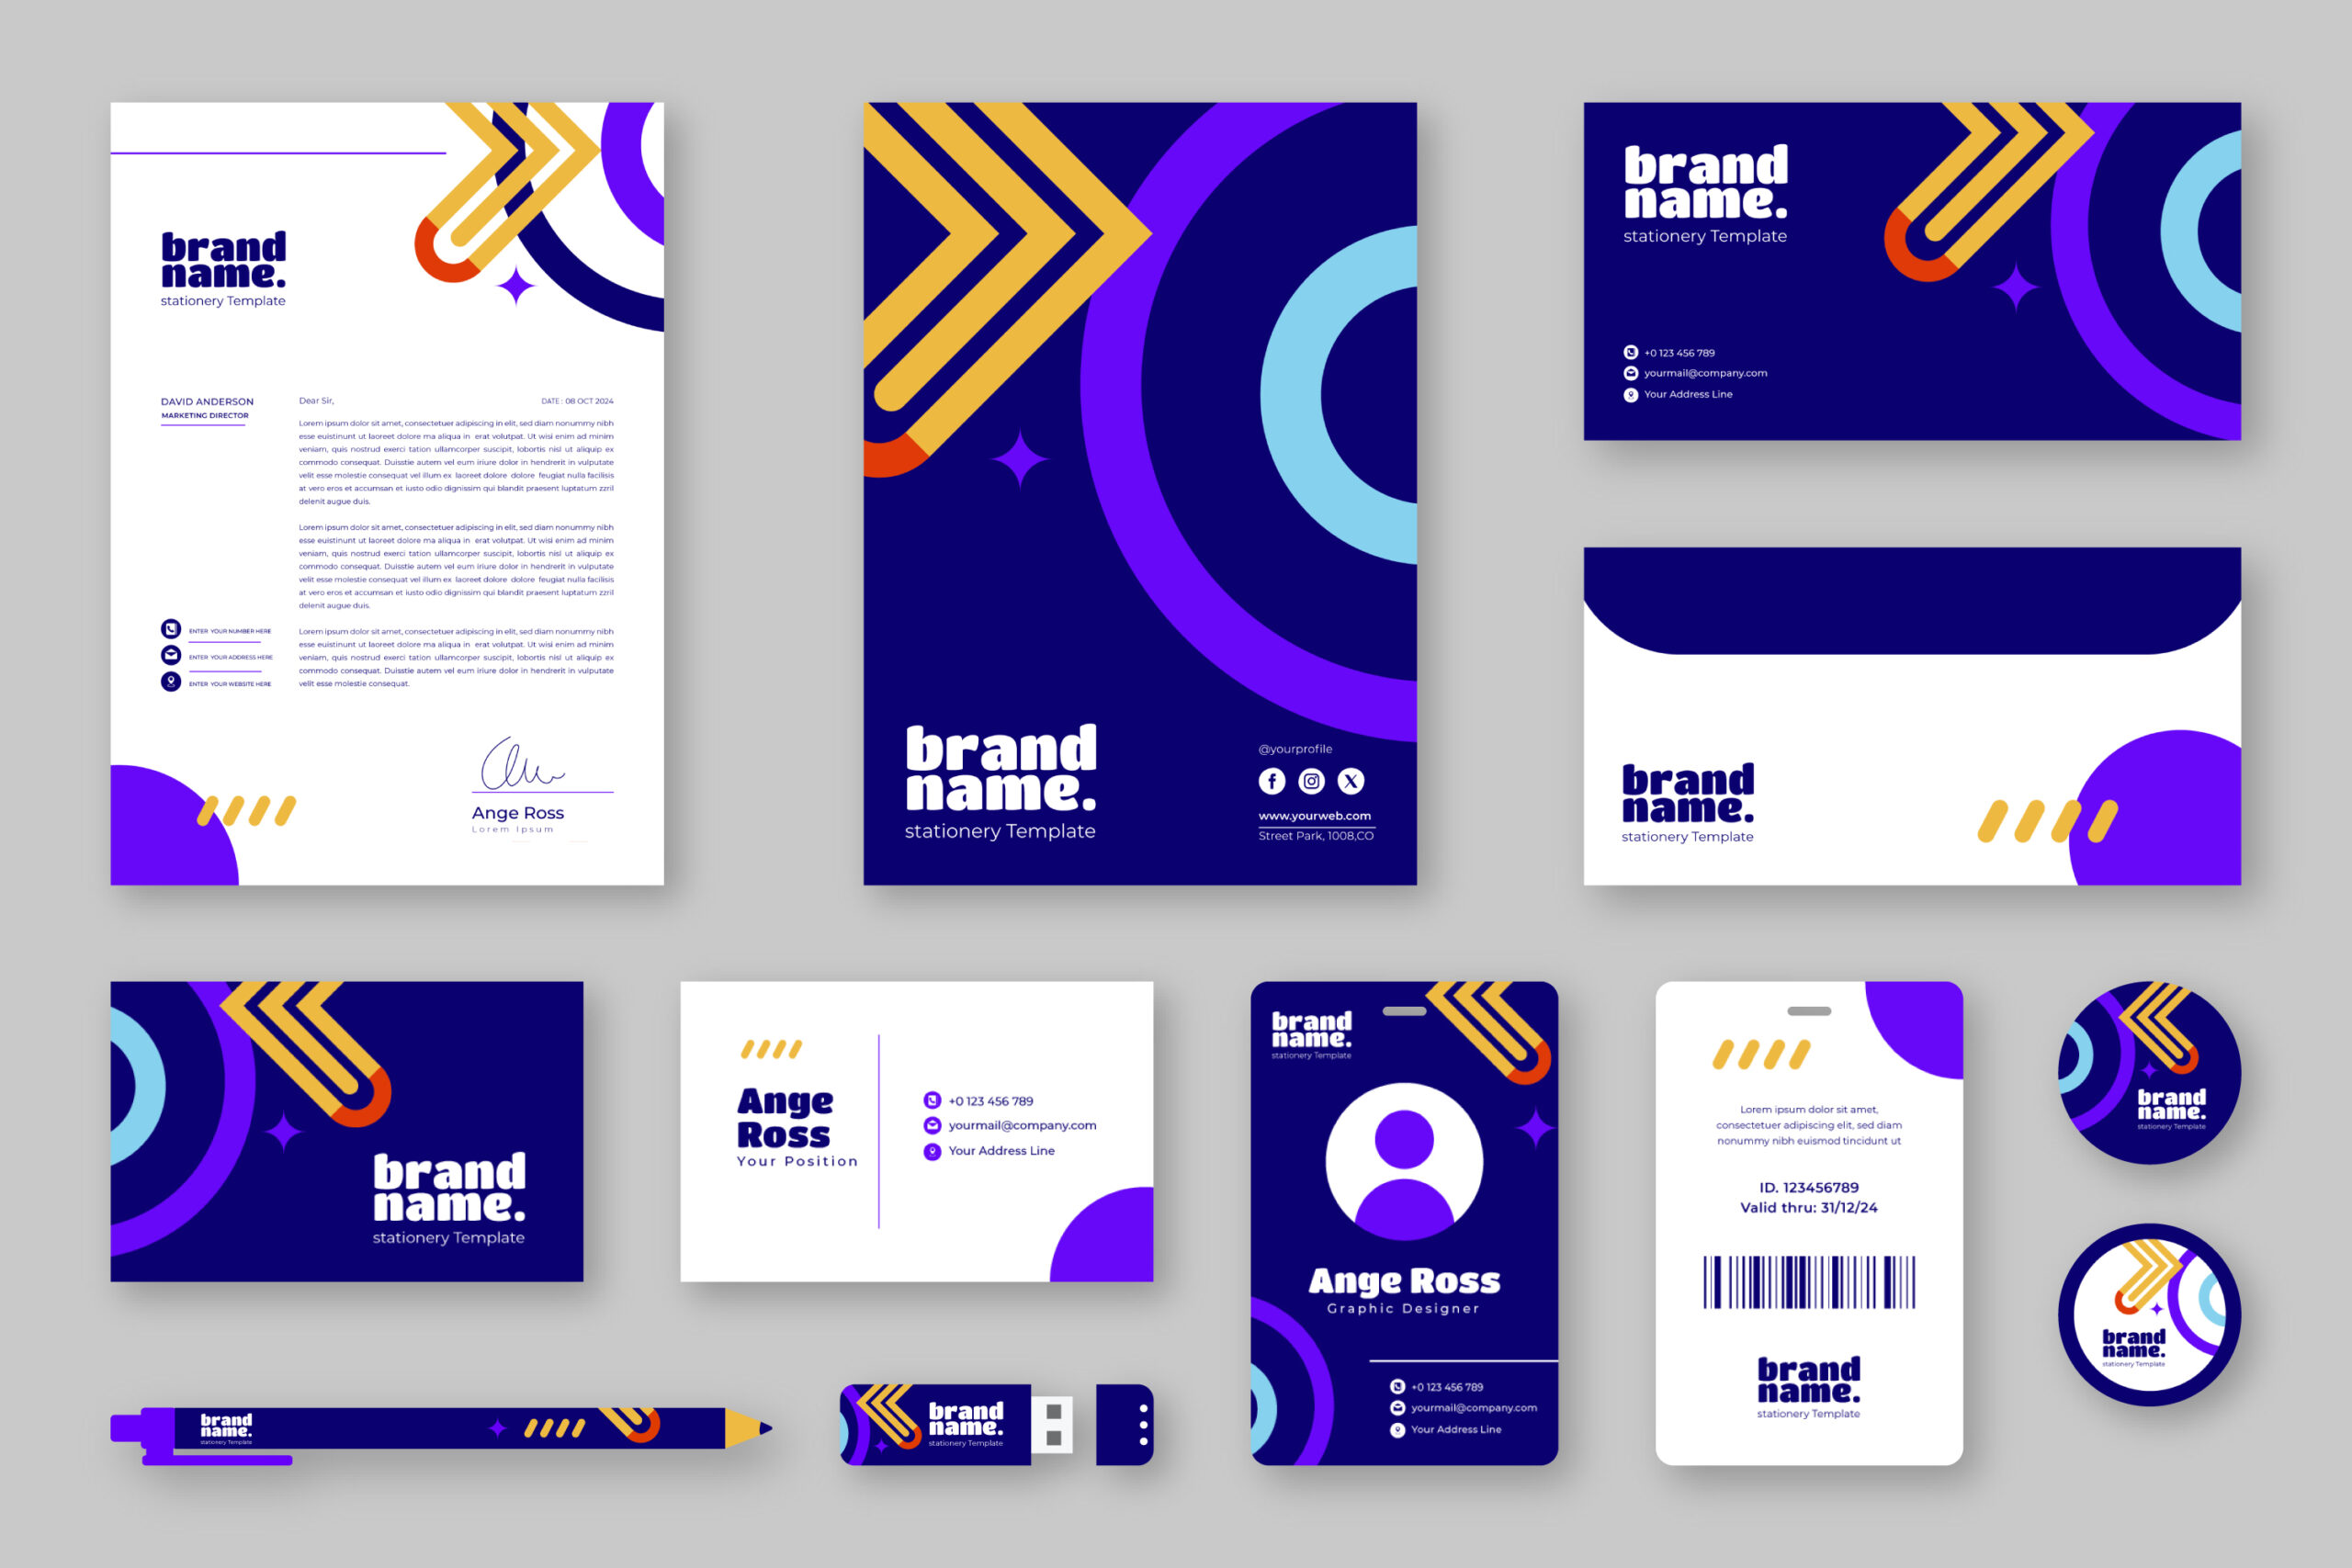
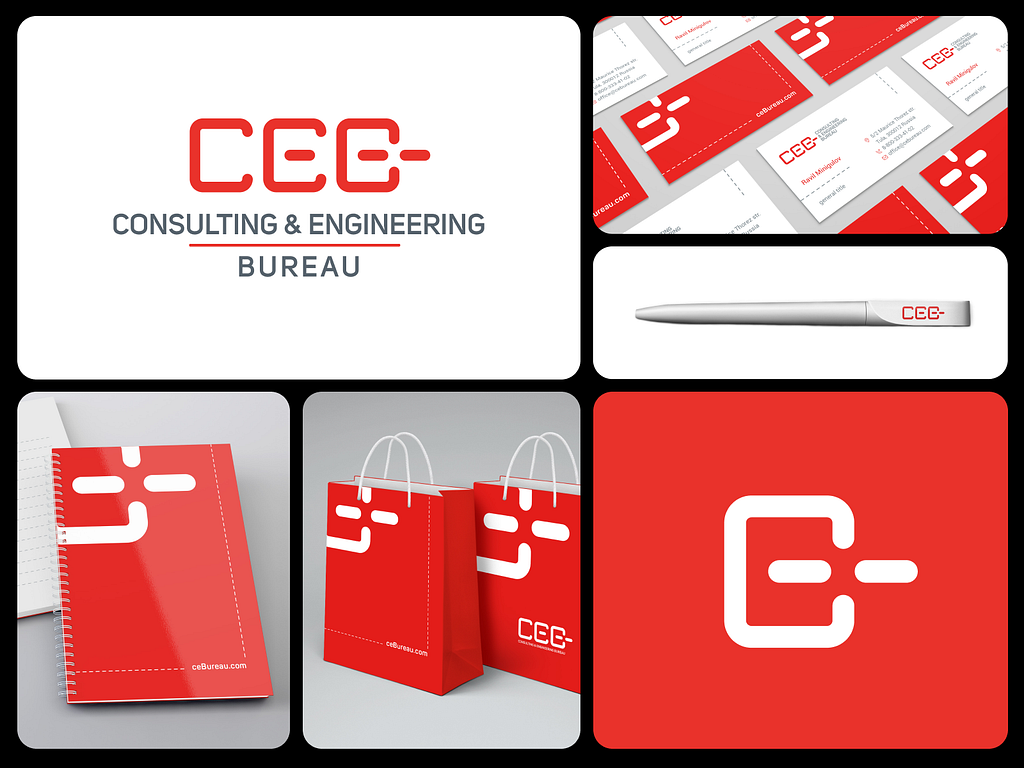
Branding is the process of crafting a unique identity for your business that resonates with your target audience. It includes your visual elements (logo, colors, typography), messaging (tone, voice, taglines), and the experience you offer your customers.
To understand branding better, let’s differentiate it from marketing and advertising:
Branding sets the foundation and defines your identity.
Marketing promotes your products or services.
Advertising amplifies specific messages to your audience.
Think of branding as the personality of your business, marketing as the conversation, and advertising as the megaphone.
Why is Branding Important for SMBs?
1. Building Trust and Credibility
A strong brand fosters trust, which is crucial for SMBs competing with larger corporations. According to Edelman’s Trust Barometer, 81% of consumers need to trust a brand before purchasing.
2. Driving Customer Loyalty and Retention
Brands that create emotional connections are more likely to retain customers. For example, a Nigerian real estate agency doubled its customer referrals after revamping its branding to include relatable, people-focused messaging.
3. Enhancing Sales and Market Positioning
Businesses with a clear brand identity stand out in crowded markets and can even command higher prices. According to a Nielsen study, 59% of customers prefer to buy products from familiar brands.
Elements of a Strong Brand
1. Brand Identity
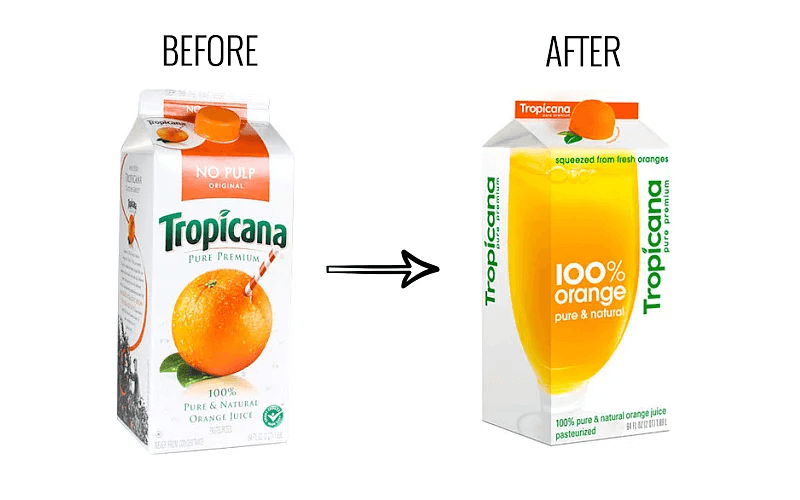
Your visual elements, like your logo, typography, and color palette, should be consistent across all touchpoints. For instance, Coca-Cola’s signature red and white evokes energy and happiness universally.
2. Brand Messaging
Craft a voice and tone that align with your target audience. A luxury hotel might use sophisticated language, while a beauty spa could opt for friendly and inviting messaging.
3. Customer Experience
Every interaction matters. Whether it’s an email response or your website’s user interface, consistency in experience builds a stronger brand perception.
Many SMBs believe that branding requires hiring expensive agencies. However, tools like Canva and Fiverr make it possible to create professional designs at minimal costs.
2. Lack of Clarity in Defining the Brand
Without a clear mission and values, your brand can feel scattered. A concise mission statement provides focus and direction.
3. Difficulty in Maintaining Consistency
Managing multiple platforms can dilute your brand message. Tools like Hootsuite or Buffer can help streamline your content strategy.
Actionable Branding Tips for SMBs
1. Create a Memorable Brand Identity on a Budget
Use Canva for designing logos, social media templates, and marketing materials.
Stick to a consistent color palette and typography across all platforms.
2. Define Your Mission and Values
Answer key questions: What is your purpose? Who are you serving? What makes you unique?
Example: A beauty spa’s mission could be, “To empower clients with confidence through personalized, top-quality treatments.”
3. Leverage Affordable Tools
Design Tools: Canva, Looka for logo creation.
Social Media Management: Hootsuite, Buffer.
Content Creation: Grammarly, Hemingway App.
FAQs About Branding
What are the 4 V’s of Branding?
Vision: Your long-term goals.
Value: The benefits your brand provides.
Voice: How you communicate with your audience.
Visuals: Your brand’s appearance.
What are the 5 C’s of Branding?
Clarity: Clear messaging and identity.
Consistency: Uniformity across all channels.
Credibility: Building trust through authenticity.
Connection: Resonating emotionally with your audience.
Competitiveness: Standing out from competitors.
How Can SMBs Measure Branding Success?
Track metrics like brand awareness (social media mentions, website traffic), customer retention rates, and engagement levels.
Conclusion
Branding is the cornerstone of any SMB’s success. It builds trust, fosters loyalty, and positions your business for growth. By investing in a strong, consistent brand identity, you can achieve long-term success in a competitive market.
Ready to take your branding to the next level? Et Nunc Digital Agency offers tailored branding solutions to help your business stand out. Let’s create a brand that drives results—contact us today!
How to Create Smarter Designs that Speak Directly to your Users
July 29, 2024
Ifeanyi Kalu
Imagine pouring your heart and soul into a brilliant website design, graphic designs, etc, only to discover crickets. No clicks, no conversions, just tumbleweeds rolling across your analytics dashboard. Or worse, imagine launching a product with stunning packaging, only to see it languishing on store shelves.
The design world used to be a bit of a gamble. We relied on intuition, guesswork, and maybe a splash of inspiration. But in today’s hyper-competitive landscape, that just doesn’t cut it. That’s where data-driven design comes in, your secret weapon for crafting experiences that resonate with your audience, driving clicks, conversions, and brand loyalty. Think of it as X-ray glasses for your design process, letting you see beyond the surface and make choices that speak directly to your users’ hearts (and wallets).
This guide will help you turn data into design superpowers. Get ready to ditch the doubt and embrace the insights that will fuel your creative process and leave your audience begging for more.
What is Data-Driven Design?
Data-Driven Design is not about robots replacing creativity or designs! It’s about using data as a compass for your website, product, or marketing campaign, guiding your design decisions towards what truly resonates with your users. It’s like having a crystal ball that shows you the path to design decisions that resonate with your audience, driving them to click, convert, and fall head over heels for your brand. Think of it like having a superpowered sixth sense that whispers “yes!” or “nope” to every design choice.
Types of Data for Design
Quantitative Data:
Think of it as the hard evidence, the numerical storytellers. These are the measurable facts and figures that reveal how users interact with your design:
Website Analytics: Numbers like page views, bounce rates, time spent on a page, and user flow paint a picture of how users navigate your website or app. Are they getting lost? What sections hold their attention?
Click-Through Rates (CTRs): This metric tells you how often users click on specific elements like buttons, links, or images. It reveals what grabs their attention and what prompts them to take action.
Conversion Rates: The holy grail of data-driven design! This shows how many users complete desired actions, like making a purchase, signing up for a newsletter, or downloading a file. It helps you understand what drives those crucial conversions.
A/B Testing Results: This powerful technique lets you compare different versions of your design elements to see which performs better. A/B testing different button sizes, headlines, or layouts can provide invaluable insights into user preferences.
Qualitative Data:
Quantitative data tells you “what,” but qualitative data tells you “why.” This is the human side of the equation, the emotions, motivations, and thoughts that lie behind the numbers:
User Interviews and Surveys: Get inside your users’ heads! Open-ended questions and conversations let you understand their needs, concerns, and desires. You’ll discover pain points they might not even be aware of, leading to unexpected design solutions.
Focus Groups: Bring together a small group of users to discuss their experiences with your design. The group dynamics can spark valuable insights and reveal shared frustrations or preferences.
Social Media Feedback: Don’t underestimate the power of online chatter! Monitor brand mentions, comments on your posts, and reviews to see how your design resonates with users. Remember, sometimes the loudest complaints come from the most passionate fans.
User Testing: Observe users interacting with your design in real-time. Watch their eye movements, listen to their comments, and track their clicks to identify usability issues and areas for improvement.
By mastering both types of data, you can transform your design process from guesswork to informed insight, ultimately creating experiences that truly connect with your audience and achieve your business goals.
How do you make data-driven design decisions?
Data-driven design isn’t just about sprinkling some numbers on your mood board and calling it a day. Making data-driven design decisions involves a strategic, iterative process combining creativity and analytical insights. Let’s unpack the steps involved, from unearthing insights to crafting successful designs:
1. Initial Research:
Define Objectives: Clearly outline the goals of your design project. Whether it’s increasing user engagement, improving conversion rates, or rebranding, having well-defined objectives sets the stage for effective data-driven decisions.
User Persona Development: Conduct in-depth research to understand your target audience. Create detailed user personas, incorporating demographic information, behaviors, and preferences. This foundation ensures that your design resonates with the intended users.
2. Gather and Analyze Data:
Quantitative data: Dive into analytics tools like Google Analytics. Analyze conversion rates, click-through rates, user flow, and A/B testing results. These numerical insights reveal how users interact with your existing design.
Qualitative data: Get personal! Conduct user interviews and surveys to understand motivations, emotions, and preferences. Analyze open-ended responses to uncover valuable patterns and hidden desires.
3. Translate Data into Insights:
Don’t just crunch numbers; make them talk! Look for trends, patterns, and unexpected correlations in your data. What story are these numbers telling? How can you translate these insights into actionable design decisions? Remember, context matters. Consider user demographics, behavior patterns, and external factors (like social trends) when interpreting data. A holistic approach ensures you glean the right meaning from your findings.
4. Ideation and Design with Data as Your Guide:
Quantitative data: Dive into analytics tools like Google Analytics. Analyze conversion rates, click-through rates, user flow, and A/B testing results. These numerical insights reveal how users interact with your existing design.
Qualitative data: Get personal! Conduct user interviews and surveys to understand motivations, emotions, and preferences. Analyze open-ended responses to uncover valuable patterns and hidden desires.
5. Unleash the Power of Testing and Iteration:
Embrace A/B testing! Compare different design variations to see which resonates best with your users. Track metrics like conversions, engagement, and user satisfaction to determine the winning design.
Continuous improvement is key. Don’t settle for your first iteration. Keep testing and refining based on ongoing user feedback and data analysis. This agile approach ensures your designs stay relevant and effective.
6. Share Insights and Celebrate Data-Driven Victories:
Data-driven design is a collaborative effort. Share your findings with stakeholders, developers, and marketing teams. Transparency fosters trust and ensures everyone is working towards the same data-informed goals.
Celebrate data-driven victories! Highlight successful design changes resulting from user insights. Recognition encourages a data-driven culture and motivates future data-driven decisions.
Additional Tips:
Invest in data visualization tools. Translate complex data into easy-to-understand charts and graphs to facilitate collaboration and decision-making.
Build a data-driven culture. Encourage continuous learning and data literacy within your team. Train your team on interpreting data and applying insights to their work.
Start small, experiment, and scale. Don’t overwhelm yourself. Begin with data-driven insights for specific parts of your design process and gradually expand your knowledge and application.
Data-driven design is a powerful journey, not a destination. By putting these steps into action, you can unlock its potential and create designs that truly resonate with your audience. So, what are you waiting for? Start your data-driven design adventure today!